
Several of you have emailed me about how I take data on the iPad, so I am here to share the nitty gritty details with you! First of all, I use the app called Numbers. This app is Apple's version of Excel.

To start, I add a basic spreadsheet. To do this, you just click the little + sign in the upper left hand corner and select "create spreadsheet." Choices come up for which type of spreadsheet you want. I usually select the "blank" template.

Then I customize a basic version of what I want my spreadsheet/graph to look like. You can easily expand the size of your spreadsheet, by just sliding the circles on the side or bottom in any direction.

Next, I add in the headings. Since a lot of my graphing done on the iPad is for our fluency timings, my usual categories are DATE, # CORRECT, # INCORRECT, and TIME. To do this, you just click on the box you want to type in, and your keyboard should pop up. Make sure the T (for text) is highlighted in the upper left side of the keyboard. Now your spreadsheet is ready to go! (At the end of this post, I will show you how to add data…right now, we are still dealing with set-up).

Then, to get your graph started, you click on the + sign in the upper right hand corner. Select the type of graph you want….I usually choose the line graph.

To connect your spreadsheet to your graph, follow the directions on the screen. You most likely will tap the graph once, then tap the columns on your spreadsheet that you want to graph. Now, whenever you add in any data to your spreadsheet, it will automatically graph it for you!


For each student, I have multiple spreadsheets (i.e. one for sight words, one for telling time, etc.), so the next thing I do, is add more spread sheets and label them. To do this, you can click the + on the left side and select "New Sheet." Or, by clicking on where it says "Sheet 1" an option will come up to "duplicate." I usually do this if the table/graph are going to look similar, because then I have my data sheet and graph ready to go without having to set them up again!

Now to name each sheet a different name, you just double click and the keyboard should pop up to allow you type in a new name. In my example below, I have 3 sheets now for 1 student (sight words, time, and money).

We now have our data set up for one student. To duplicate this entire document, you can go back your list of spreadsheets. Click "edit," then select the spreadsheet you just created and click the plus button in the upper left hand corner. This duplicates the entire set of spreadsheets you just made! Then, you can just go back into each student and customize their data sheets by changing up little things like the names of the sheets or headings.

To name your set of spreadsheets for each kid, click on the name. The keyboard will pop up for you type in a new name. I use my students' initials so that if I were to ever lose my iPad, the information would be kept confidential.

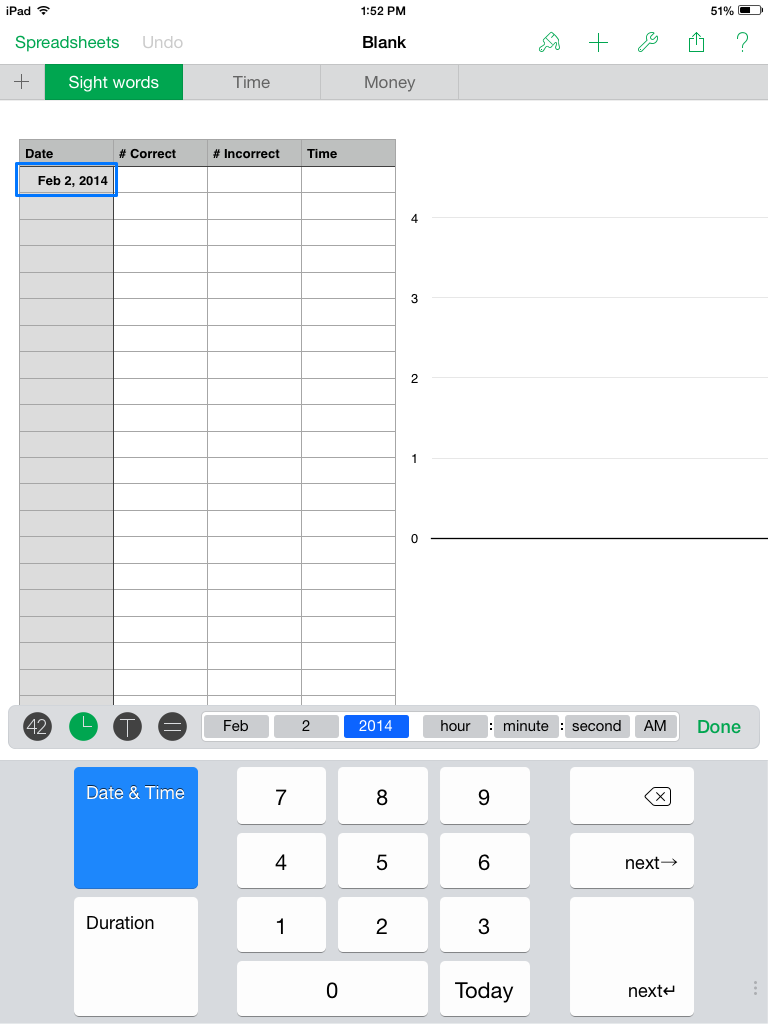
Now, onto adding in data. When you want to add something to your table, double click into the box you want to type into. Then, if you would like to add a date, you can select the button on the top left of the keyboard that looks like a clock.
To add in Numbers, you can select the button on the top left of the keyboard with "42" on it. Notice, that as I typed in my numbers under "corrects"/"in corrects," they automatically graphed them for me. To move between cells on your table you can touch a new cell, or use the next arrows provided on the keyboard.

To add in Text, select the "T" button and you have access to your regular keyboard.

If you need to add text, you can add a text box by clicking on plus sign on the upper right hand corner, and selecting the tab with "T". Then select the type of text you want. I use these when I want to include a definition of the behavior I am tracking or to explain any phase change lines.

This program has a lot of other features which I didn't cover in this post. You can completely customize your tables and graphs down to making each cell a different color or font. You can add pictures from your camera roll; add shapes, lines, or arrows to your graphs; and send copies of the spreadsheet/graph via email or text message!

Whew…that was a doozy of a post filled with a lot of info. Hope you find this helpful! Check back in tomorrow for a post on how we implement data collection in my classroom and to see some real life examples of our data! If you have any additional insights into this program or another you like to use, please let me know!
Thank you, thank you, thank you! I teach an autism resource class of 15 students, K through 5th grade. This is invaluable to me!
ReplyDeleteAwesome! Glad I could help!
Deleteawesome tutorial!!! Thamlks
ReplyDeleteI just received an ipad through a grant and I've been wanting to use it for data collection but didn't really know where to start or what program or app would be best. Thanks for the tutorial- super helpful!
ReplyDeleteThis is really more data analysis than data collection, but thanks all the same.
ReplyDelete